Learn Computer With Savvy Niest

Google Data Studio Course

Learn how to create interactive reports, and dashboards and do data analysis with Google Data Studio.
4.9 Rating
5/5

₹399

₹3299

79% off

Play Video

Course Description

Google Data Studio is a data visualization platform that makes reports easier to create and understand. Google Data Studio is a powerful tool for creating reports and dashboards, which you can use to analyze, present marketing results and make better decisions.

In this course you will learn Google data Studio from Beginners to Advance. (Courses by Satish Dhawale Sir) सभी कोर्सेस आसान हिंदी भाषा में | Read More पे क्लिक करे और कोर्स के फीचर्स जानने के लिए |

Course Features
✅सभी कोर्सेस सरल हिंदी भाषा में
✅Google Data Studio बेसिक से एडवांस कोर्सेस
✅35+ DETAIL वीडियोस ????
✅ कोर्स प्रैक्टिस फाइल्स उपलब्ध
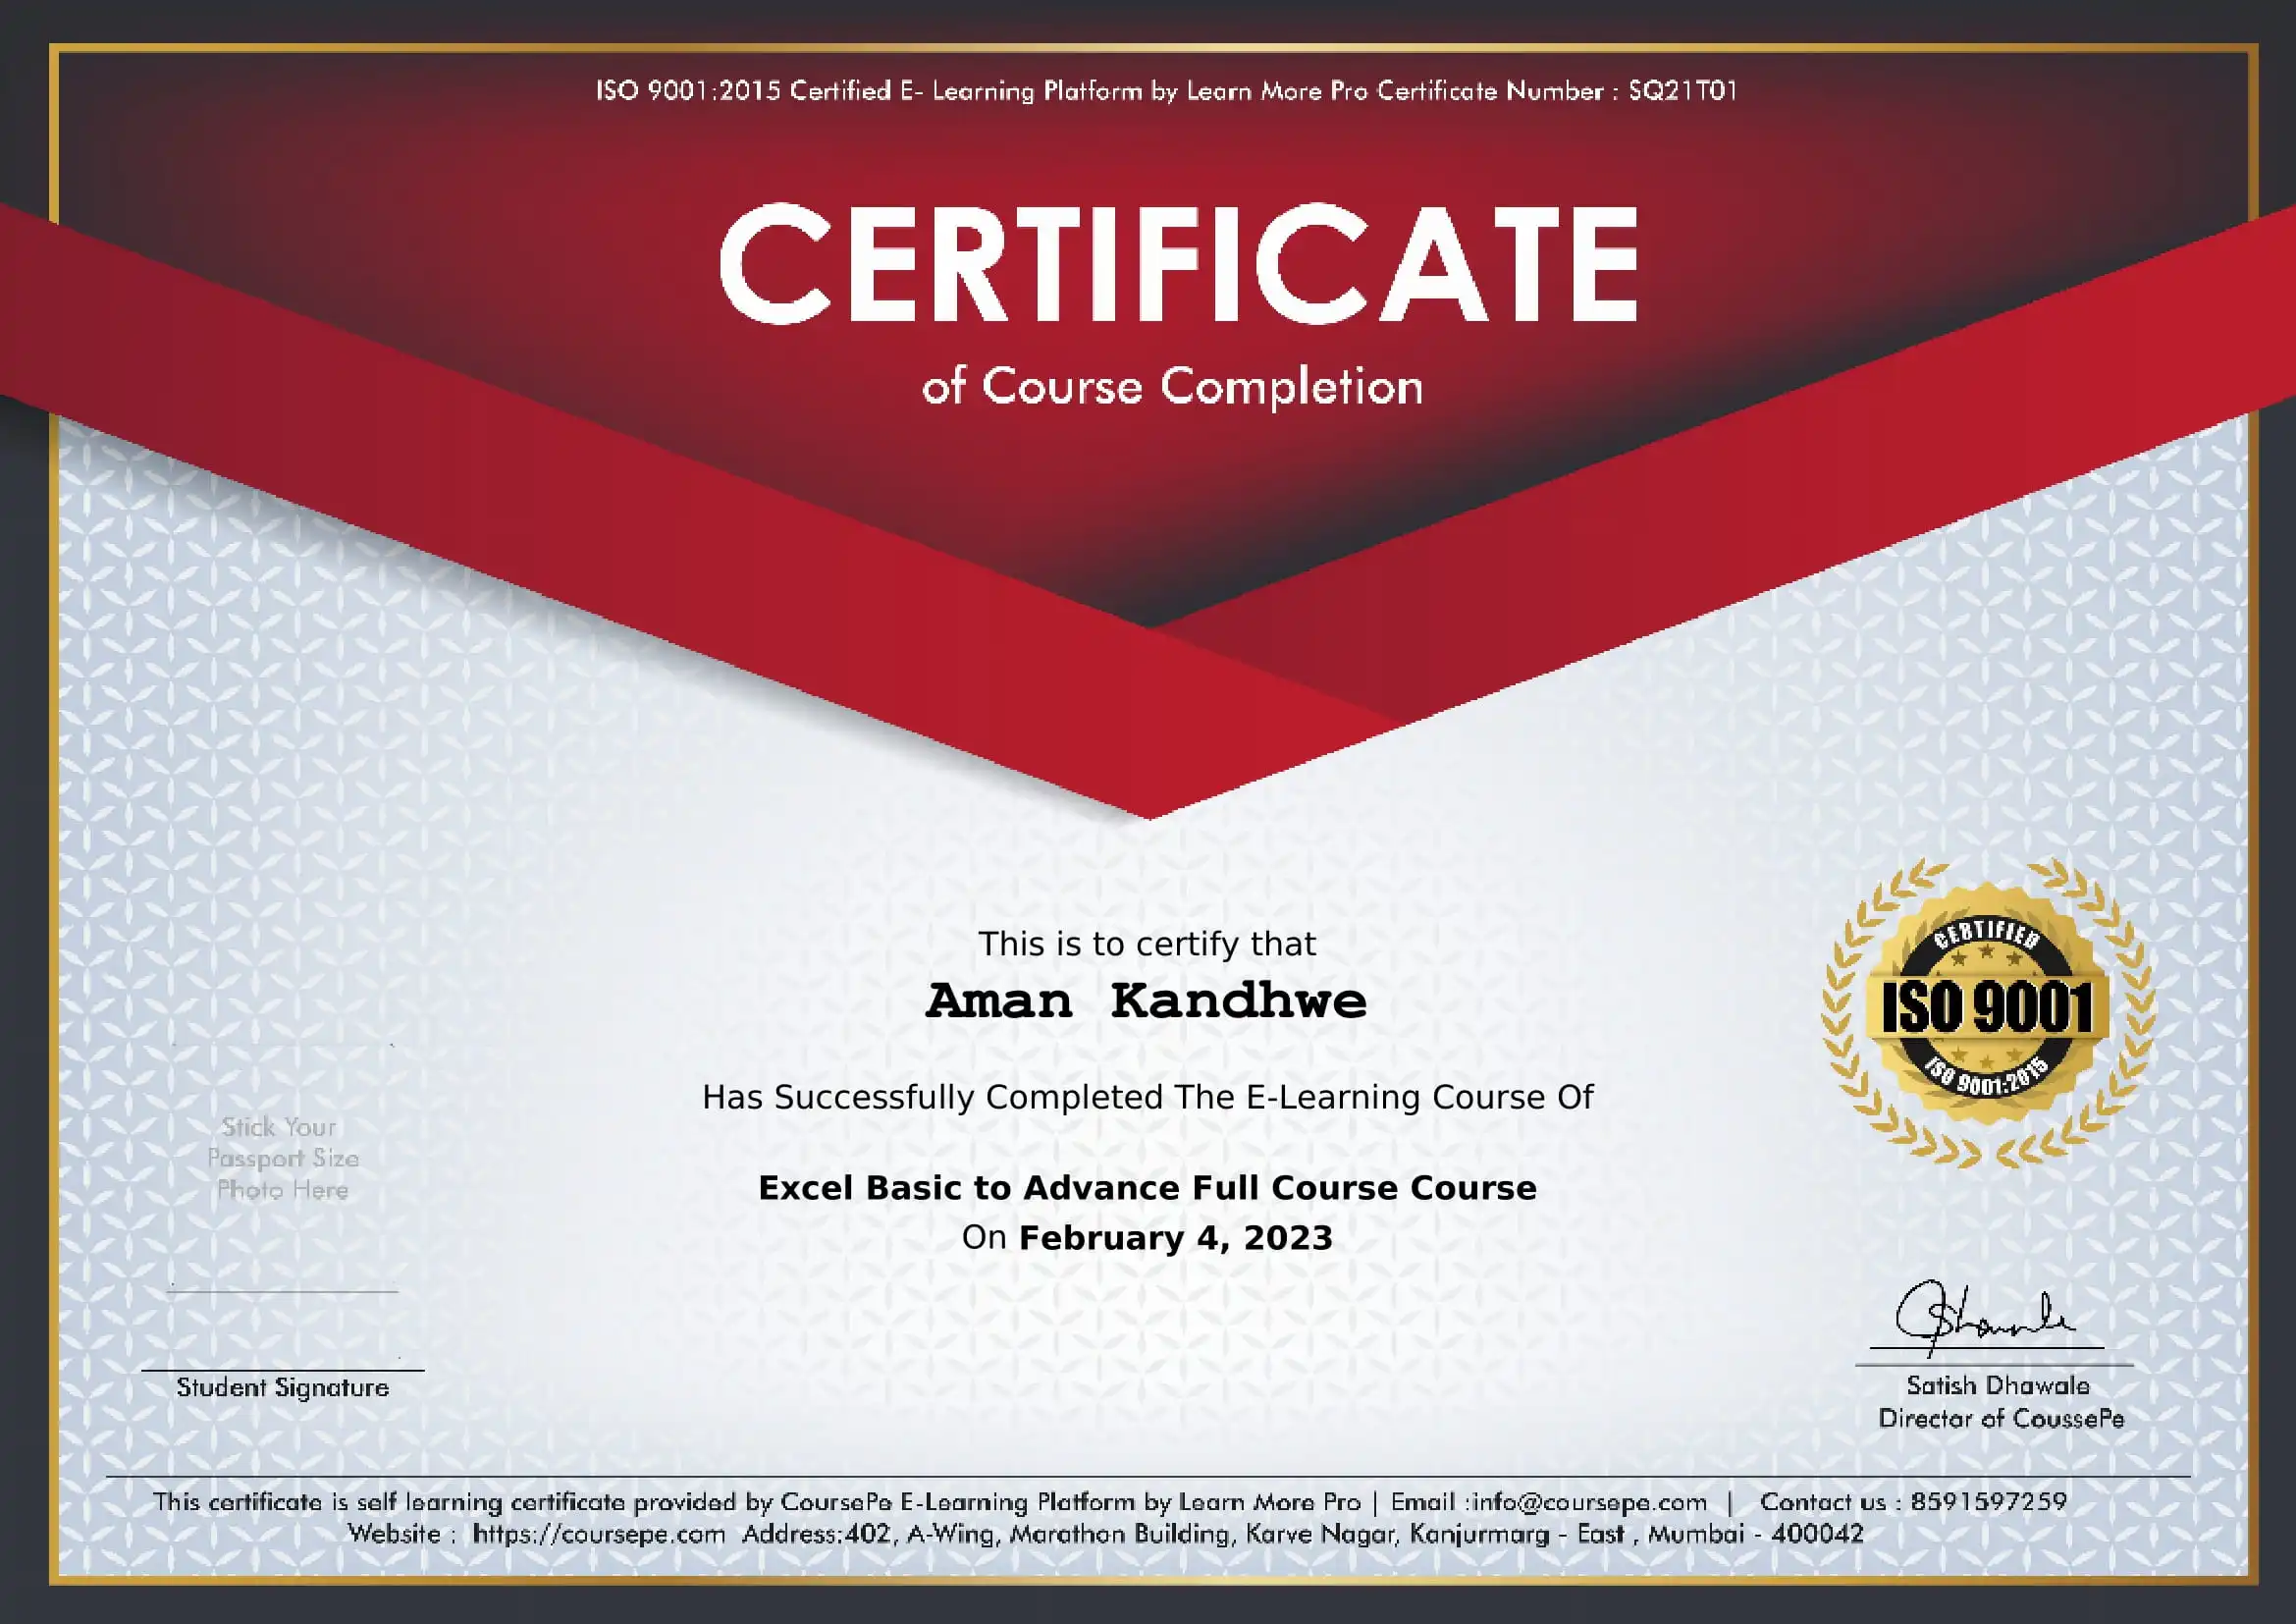
✅कोर्स कम्पलीशन सर्टिफिकेट
✅इंस्टेंट एक्सेस –
⬇️ Download Video in APP

Free BONUSES-
✅ PDF शॉर्टकट्स

????‍???? This course is Created by : Satish Dhawale
सतीश सर को कंप्यूटर के क्षेत्र में टीचिंग का लगभग 16 साल का अनुभव हैं जिसमे उन्होंने 14 साल तक ऑफलाइन कंप्यूटर संस्थान में 40000+ से अधिक स्टूडेंट्स को और अपने Online अपने Learn More Channel के माध्यम से लगभग 17,00,000+ से ज्यादा स्टूडेंट्स को कंप्युटर कि शिक्षा देने का कार्य किया हैं। YouTube : 7 Silver and 1 Gold Button Award Winner for their 7 YouTube Channels

Course Benefits

Materials Included

Course Curriculum

Module 1 - Introduction

Preview

Play Video

1 - What is Google Data Studio and Understanding of Data

Preview

Play Video

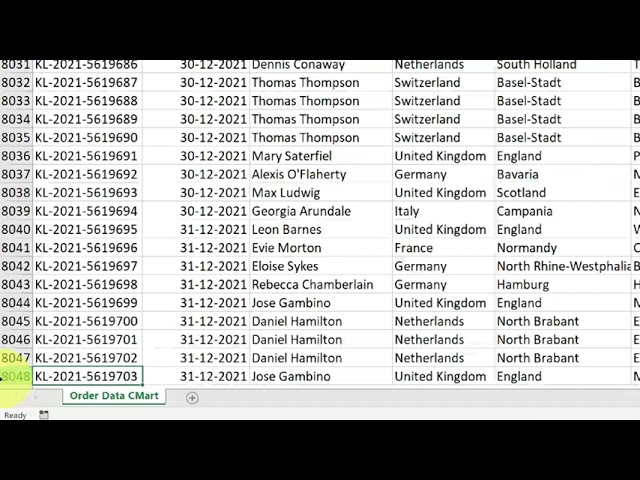
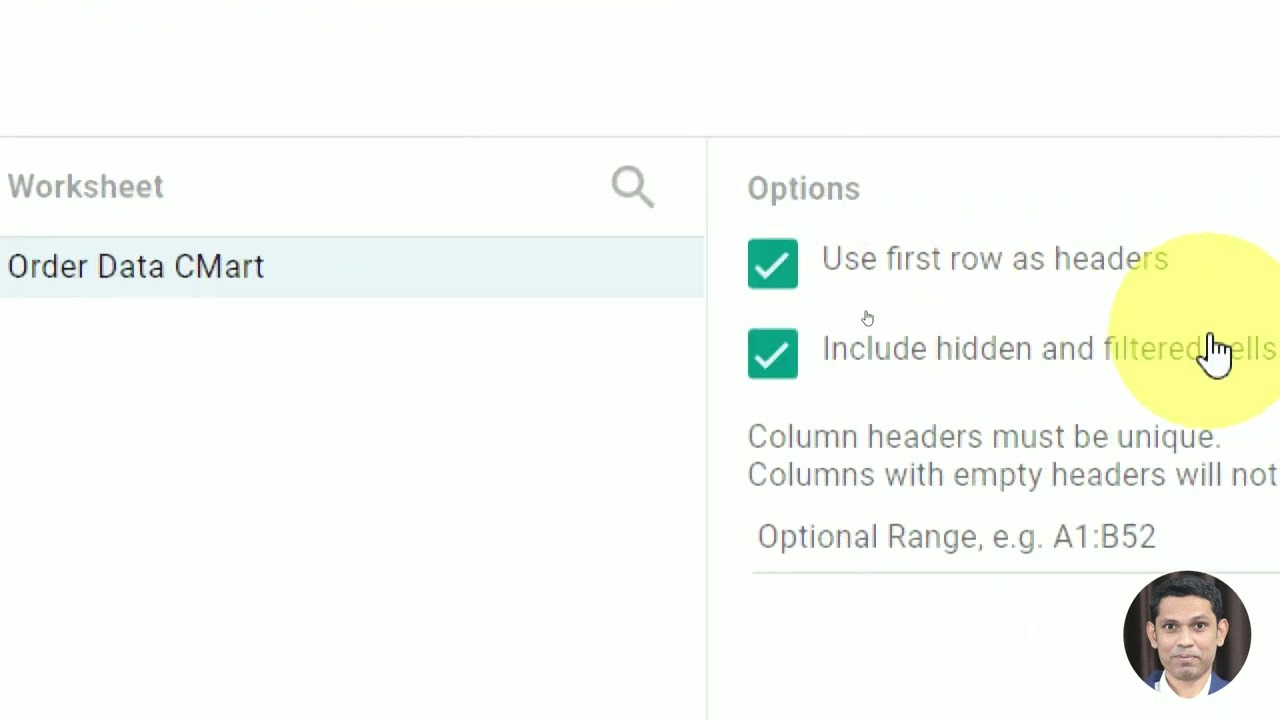
2 - Import data in Goolge Data Studio

Preview

Play Video

3 - Google Data Studio Overview

4 – Drill Down and Drill Up in Table 4.48 Min
5 – Optional Metric and Metric Slider 5.50 Min
6 – Conditional Formatting in Table 12.08 Min
7 – All about Table Style 13.53 Min
8 – Add Filter in Table 7.05 Min

Module 2 - All About Tables

01 – All about Aggregation 5.42 Min
02 – Comparison Calculation 7.02 Min
03 – Running Calculation 7.08 Min

Module 3 - Calculations

01 – All about Aggregation 5.42 Min
02 – Comparison Calculation 7.02 Min
03 – Running Calculation 7.08 Min

Module 4 - All About Pivot Table

1 – Adding and Setup of Pivot Table 11.52 Min
2 – Style Option Pivot Table 6.40 Min

Module 5 - All About Scorecard

01 – Add, Setup and style of Scorecard 9.36 Min

Module 6 - All About Controls

1 – Drop down and Fixed size controls 9.50 Min
2 – Input box, Advance Filter and Slider 6.03 Min
3 – Date Range Controls 4.36 Min

Module 7 - Custom Field

1 – Create Total Sales Field 7.12 Min
2 – Create Profit Margin Field 4.20 Min
3 – Add Custom Date field 7.25 Min

Module 8 - Calculated Filed Using Formulas

1 – Upper Formula, Concat Formula 8.44 Min
2 – Regex Match Formula 6.45 Min
3 – Case Formula 6.55 Min

Module 9 - All About Charts

1 – Creating Time Series Chart 8.58 Min
2 – Style options of Time Series Chart 11.24 Min
3 – Bar Chart or Column Chart 7.22 Min
4 – Pie Chart and Donut Chart 15.00 Min
5 – Combo, Area, Scatter, Bullet Treemap 12.54 Min

Module 10 - Complete Dashboard

01 – Dashboard – Part -1 18.00 Min
02 – Dashboard – Part -2 5.15 Min
03 – Dashboard – Part -3 15.43 Min

Module 11 - Blending data and Sharing Reports

01 – Blending data 13.32 Min
02 – Sharing DATA 6.27 Min

Course Instructor

Satish Dhawale

Founder & CEO of CoursePe

Satish Dhawale has over 15 years of experience in the field of computer education, he has been promoting computer education through his blog www.learnmoreindia.in and YouTube channel Learn More with 1.5 M+ subscribers for more than 5 years now. 1 Gold Play and 5 Silver Play Awards have been awarded by YouTube. Learn More YouTube channel provides tutorials related to computer and technology in the Hindi language to Learn and improve your life. 

Course Completion Certificate

₹399

₹3299

79% off

Course Rating By Summary

5.0
5.0 out of 5 stars (based on 2 reviews)
Excellent100%
Very good0%
Average0%
Poor0%
Terrible0%

Submit Your Feedback

Mohd Kamar

March 12, 2023

Very good

Mohd kamar

Ashok Kumar

February 9, 2023

Very Useful Video

Ashok Kumar